Crucial App Metrics to Look for After Launching

How do you know if your app is performing well? The answer is surprisingly simple: data. Specifically, app metrics.
You’ve spent plenty of time and money on the construction of your app and now it’s time to begin assessing how it’s performing with your audience. Here, we’ve noted 22 of the most beneficial app metrics and sorted them into a few key categories: conversion, user engagement, performance, customer satisfaction, and acquisition.
This guide is designed for those who have launched an app and for those who are currently meandering through the pre-launch phase of the development process.
In addition, the information presented here will be useful if you’ve had an app launched for a period of time already but aren’t sure which app analytics you should be keeping track of.
User Engagement App Metrics
DAU (Daily Active Users)
Chances are that you know how many people have downloaded your app. But do you know how many people use your app on a daily basis? This metric is designed to measure exactly that.
This success metric refers to how many individuals use your app every day. It does not, however, keep track of how many times a day or how many days a week someone uses the app. Each individual is counted one time.
Ideally, the number recorded here will grow each month. If it starts to lag behind, you’ll need to push notifications and amp up your marketing tactics to engage users and make the app more popular.
App Session Intervals
App session intervals is a metric that measures how often a user opens the app. Basically, it determines how engaged your users are by recording the time between each use of your app. Most of the time it’s better to see shorter session intervals because it means that your app is being opened frequently.
If your metrics are showing long intervals, the key to shortening them is by actively inserting your app into the daily routine of your users. Provide users with a reason to open and engage with your app each day.
Average Session Length

While app session intervals record how often your app is used, session length is a metric that measures the length of time that users spend on your app each session. This metric isn’t universal and tends to depend on your industry.
This is worth tracking because it gives you a good idea of how valuable your app content is to those who use it. Apps such as Netflix and Spotify benefit from this metric; it tells them whether their recommendations are in sync with their user’s preferences.
For apps like Uber, a longer session time isn’t generally something to strive for. In fact, a long session time on an app like this is likely to mean that the user is dissatisfied because they were unable to find a ride quickly.
Retention Rate
This metric is pretty easy to figure out thanks to its name. Ultimately, it’s a metric that records the
percentage of users your app retains and, as a result of it, you’ll also be able to see how many users are being lost to churning.
When you use this metric, the numbers you plug in will depend on what information you’re hoping to gain from the data. If you’re calculating the rate of retention based on the number of people who downloaded your app last month, the data will reflect the relationship between your marketing and your user engagement.
We can help you turn your idea into reality, take over your existing project, or extend your current development team.
Schedule a free consultation at hello@tms-outsource.com, or fill out the form and we will follow up with you shortly.
Churn Rate
The churn rate is the exact opposite of the retention rate. It’s defined as the rate at which users are uninstalling your app and/or canceling or downgrading subscriptions. Although churn rates are a negative aspect right off the bat, they become particularly problematic when valuable users fall victim to it. When this happens, the economics of your business can be affected.
Regardless of the industry you operate in, rising churn rates are bad business. The hardest part is that it’s so difficult to discern why users are abandoning your app, as there are a whole host of potential reasons. These can include app crashes, app rivalry, poor usability, and lack of new content.
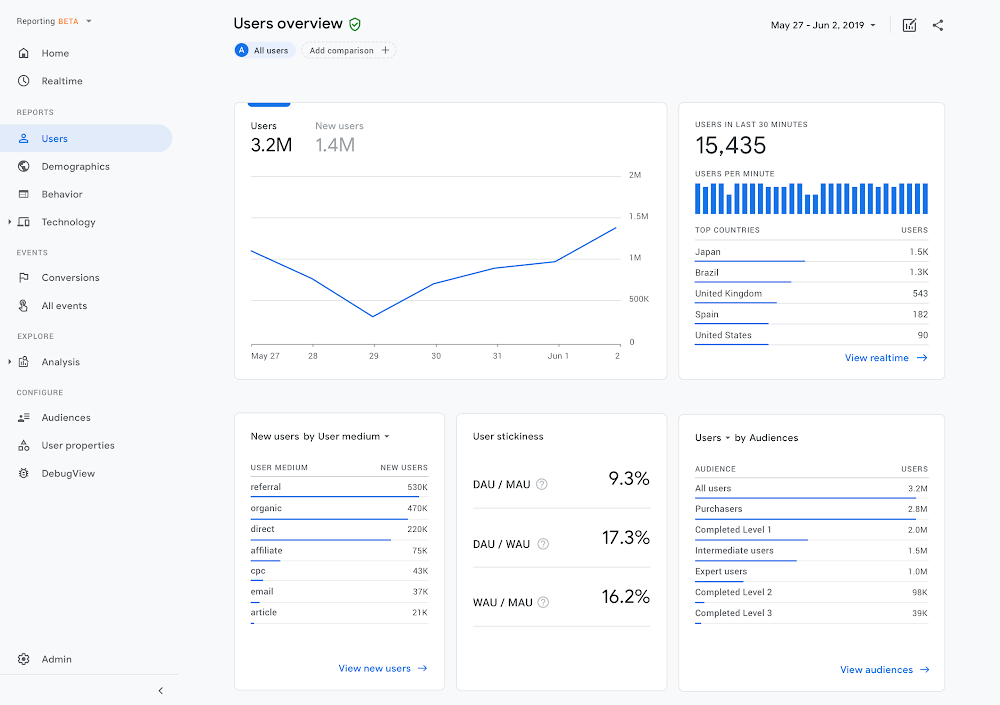
Stickiness

App stickiness is a metric tracking system that is often referred to as the number of times a user opens your app. It’s an important factor that indicates the popularity and “stickiness”, which is the general idea that the more times a user generates a session, the better.
When measuring this metric, it’s crucial to remember that in the world of digital analytics, sessions are defined as the number of times that users perform a certain set of actions. This being said, it’s essential to clearly define what a session is for your particular app.
Stickiness can be calculated by diving your DAU by your MAU.
Stickiness= DAU/MAU (Daily Active Users/Monthly Active Users)
Acquisition App Metrics
ARPU (Average Revenue Per User)
On average, how much do users spend on your app? That’s the question that this metric’s data answers. It also shows you how well you’re able to make additional sales.
This data is determined by looking at the cash generated through ad clicks and impressions, in-app purchases, paid downloads, subscriptions, and any other forms of monetization you may offer.
This figure is multiplied by the size of the user base, which is also known as the active user base, to give a rough idea of the app’s value as a whole unit.
ARPU = Lifetime Revenue/# of Users
Lifetime Value
Another one of the key metrics to measure success, lifetime value tells you how much value each of your users is bringing to your app.
In order to provide a valid comparison, you’ll need to calculate your CPA (Cost Per Acquisition), which is calculated by diving the costs of your ad campaign by the number of total acquisitions produced by said campaign.
Lifetime value targets the calculation of the value you expect to gain from an average customer during the time in which they are a customer. This value can be the revenue or profit and can be valued at the cost before marketing costs or the costs after marketing. It’s ideal to determine this ahead of time and use the same values each time to see consistent data.
Cost per Acquisition
This metric tracks how much you are spending in order to acquire an active, paying user or new subscriber. This cost includes things like money spent on advertising or PR, the costs of technology like infrastructure and hosting, as well as salaries or contract fees for design, support, development, legal aid, or other assistance.
You’ll need to adjust your CPRA depending on the revenue generation capabilities within your app. As an example, if you offer a paid app, you’ll want to keep your CPA below the cost of your app.
CPA = Cost/# of Acquisitions
Customer Satisfaction (CS) Metrics
Reviews
User reviews directly impact how many downloads an app receives. When a potential downloader opens up the app store page for your app, he or she will almost always look toward the comments for reviews of the app in order to decide whether they will download it or not.
When your app receives a negative review, it’s important to take it seriously and look into the issue. If there is anything that can be done to remedy the problem that was mentioned, it should be done.
Ignoring negative feedback will result in fewer downloads and diminished app success. It could also impact your churn rates.
Downloads
Units, more commonly known as simply downloads, are a representation of the number of times that an app has been installed. It is typically the first telltale sign of how well an app is doing.
For example, if you’re noticing very few or no downloads when watching your app metrics, you’ll need to search for problems within your marketing funnel – don’t worry, we’ll go further into marketing funnels in a bit.
By tracking your downloads over a long period of time, you’ll be able to accurately gauge how well your marketing tactics are working.
Active Users
Despite the similarity in these app metrics, downloads and active users aren’t the same things. Downloads refer to how many people have downloaded the app but does not tell you any information on how many users actively use the app, which is the most important of the two.
The number of active users that your app can be tracked in a number of ways. You can track it by monitoring those who launch the app frequently or by those who perform actions within it on a regular basis.
Average Screens Per Visit
In the world of mobile app analytics, a “Screen” refers to a page visited by a user. Each page has a distinct URL, which can be tracked by using basic techniques. In this case, higher numbers are better than lower numbers because they mean that users are spending more time in your app. It also means that they are navigating to more pages and actively engaged.
When you rely on advertising for monetization, this number is especially important. This is because, generally, the more screens a user navigates to means the more chances you have to show them ads, which earn revenue.
Conversion App Metrics
Goal Completion
Regardless of whether you’re monitoring mobile apps or websites, goal completion is a metric that is crucial to the success of your application. Goal completion is used by major companies like Google and is used to track virtually anything and everything that signals that users are using your platform and retaining value from it.
You can think of goals almost like checkpoints. Every checkpoint can serve as an eventual goal; signing up can be a pathway to a large goal such as making a purchase or subscribing to a paid service.
One of the best parts of using goals in this way is that there’s no need to decide on a concrete definition. In addition, goals can be set based on the most important aspects of your users’ activities. You can use anything from registration to subscriptions as a goal and checkpoint.
Organic Conversion Rate

The ideal situation is that users would discover your app because it has gone viral and is spreading like wildfire. One of the best ways to gauge the progress of this situation is by measuring the organic conversion rate of your app.
Organic conversion rate is a mobile app measurement that tracks unpaid discovery. In other words, it keeps track of organic searches, word of mouth mentions and recommendations, influencer marketing tactics, apps that are marked as “related” on the app store, and any other conversions that come about as a result of advertising that hasn’t been paid for by you, the developer.
To increase the conversion rate, you can offer users personal offers, use CTA buttons, and ensure that every action made within your app leads to a conversion in a way that is clear and easy to navigate.
Paid Conversion Rate
Paid conversion rates are the opposite of organic conversion rates. These conversions include PPC advertising conversions, social media ads such as promoted Twitter tweets and boosted Facebook posts, sponsored reviews or posts, display ads, and all other marketing methods that involve the exchange of money for views, mentions, or likes.
One popular form of paid conversion that you may be familiar with is that of YouTube videos in which creators are paid to try out products or apps and give reviews on them.
Return on Investment (ROI)
The return on investment is calculated by diving the number of gains (revenue or customers) by how much money has been spent on marketing. When figuring out this calculation, be sure to factor in all aspects of marketing including expenses incurred and any time spent.
ROI= (Gain of investment – Cost of investment ) /Cost of investment
AOV (Average Order Value)
The AOV user metrics system is used to measure the amount of money that each app user spends. This number, although helpful, isn’t always the best metric to go off because not all users spend money on apps.
So, instead of tracking the AOV of all users, you could opt to track the AOV of paying users specifically. To get an accurate number here, you need to calculate the overall AOV of all users and then eliminate the users that aren’t paying. This will leave you with the AOV of all paying users.
If your AOV and AOV of paying users are drastically different, it’s a sign that the majority of your app’s users are not spending any money.
App Performance Metrics
App Latency
The app latency is the interval of time between API proxies being triggered and their response. This is also known as load time and, generally, you want this number to be as low as possible. KPI is tied to load times and the behaviors that correspond to them. This number is one you want to be as high as possible; in other words, higher numbers mean faster response.
Now, it’s important to note that latency isn’t the same as speed. For example, latency is the measurement of how long it takes a button to be pressed while speed is, well, the speed of how quickly things happen after the button is pressed.
App Load Time

Extremely important, app load time needs to be perfected and maintained in order to avoid users abandoning your page before they reach the desired content. People want to have quick, seamless mobile experiences and when pages take too long to load, both apps and websites suffer.
Number of Crashes
Crashes are almost always a problem related to app performance. This metric serves as a way to measure how often your app closes without prompting while it’s in use. A high number of indicated crashes can be easily identified and is often cause for the abandonment of your app.
Ending thoughts on app metrics
As is true with any business project, it’s important to ensure that your app has good performance and is well received by your target audience. Using app metrics, you can ensure that you have all the necessary data you need to make adjustments and informed decisions regarding your apps.
Working with a developer is an easy way to help make sure that you’ve set everything up properly. Often times, app developers try to do things themselves and end up creating more problems than doing themselves any good.
When using metrics, make sure to choose only good metrics – that is, choose only the metrics that you need and will use and avoid using extra when you don’t need to.
Looking for a development partner?
If you’re looking for a technology partner, development team augmentation, or just a company for your software&app development initiatives, consider TMS.
TMS is a software and digital company in Belgrade, Serbia. We develop innovative and modern software.

A few examples include premium booking software Trafft, MedTech apps like MR Prepare, or MarTech/AdTech apps like the Advise Media Suite, among other great software examples.
Check out our services and also some of the work we’ve done for our clients. Who knows, maybe we’ll form a successful relationship.
Schedule a free consultation at hello@tms-outsource.com, or fill out the form and we will follow up with you shortly.
If you enjoyed reading this article about app metrics, you should read these as well: